
Using the Data Access Panel
The Data Access panel gives you a clear view of how your integration is performing.
It shows which data models are able to read, create, and update data within the integration, and highlights any issues with detailed error messages—giving both you and our Support team the information needed to fix problems quickly.
Accessing the Data Access Panel
-
Navigate to the Integrations section in Propexo.
-
Select the relevant PMS, and then select the relevant integration.
-
The Data Access panel will appear below the integration details. It will:
- Highlight any unsupported models.
- Flag unsuccessful connections.
- Provide relevant error messages to assist troubleshooting.
You can trigger another data access check by clicking the “Retest all models” button.
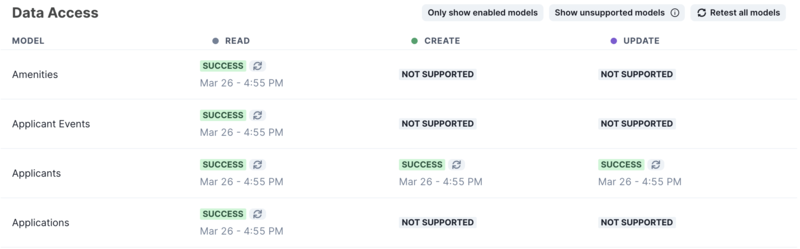
Example: Successful Connection
Below is an example of the Data Access panel for a successfully connected integration:
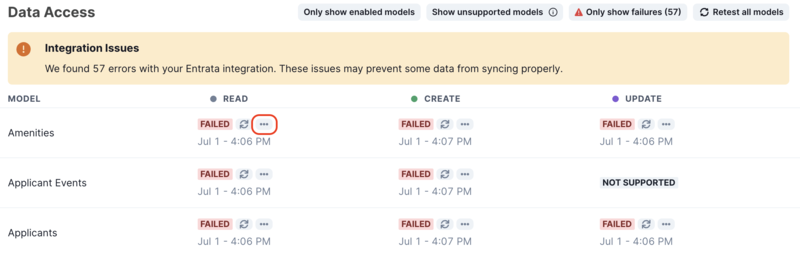
Troubleshooting a Failed Connection
If a connection fails, you can troubleshoot it through the Data Access Panel:
- Click the action button to the right of the failed connection.
- View the detailed error message.
- In many cases, the error message will provide enough information for you to resolve the issue yourself.
- If not, please share the error with our Support team for further assistance.
Example of a failed Data Access panel, with error message button highlighted: